

Ethereum Casino Fees Measured: CAD 0.0316 a Transfer
In short: Ethereum network fees are the one deposit cost a player can check without asking anyone: the median payment ran CAD 0.0316 in the month to , while seven of the eight casinos we checked never publish a fee of their own.
We pulled every receipt out of 720 hourly blocks of Ethereum, and the median transfer cost three Canadian cents. The casino's own cut is the part we could not price, because seven of eight operators never print one.
What a Median Ethereum Transfer Cost
A median transfer of ETH cost CAD 0.0316 across the 30 days to . That is three Canadian cents, or US$0.0223. Eight transfers in ten landed between CAD 0.0056 and CAD 0.1793, so even the dear end of the normal range stays under nineteen cents. That price covers the chain alone; the casino's own charge is a separate figure, further down this page.
The average told a different story: CAD 0.0783, two and a half times the median. That gap is the shape of the data talking. A few rushed, expensive transactions drag the mean somewhere no typical payment ever goes, which is why we quote the middle of the pack instead.
The median gas price behind the figure was 0.4101 gwei.
These come out of receipts, not off a gas tracker. We read 720 blocks of Ethereum, one per hour of the month, then took every receipt inside each block. That gave us 185,167 transactions. Of those, 54,083 were bare ETH transfers, while 43,682 moved USDT or USDC. A transfer counts as bare when its receipt reports gasUsed of exactly 21,000 with a status of 1, because 21,000 is the floor of the machine: one byte of data lifts it. The fee is that gas figure times the effective gas price on the same receipt, so it is money taken from a sender rather than an estimate of it.
Ethereum and Rollup Fees We Measured
| Operation | Median fee, CAD | Middle eight in ten | Transfers read | Against mainnet |
|---|---|---|---|---|
| Bare ETH transfer, Ethereum | 0.0316 | 0.0056 to 0.1793 | 54,083 | baseline |
| USDT or USDC transfer, Ethereum | 0.1503 | 0.0169 to 0.5111 | 43,682 | 4.76 times more |
| Bare ETH transfer, Arbitrum One | 0.0016632 | 0.0015084 to 0.0021527 | 2,212 | 19.0 times less |
| Bare ETH transfer, Base | 0.0004894 | 0.0004427 to 0.0010774 | 1,691 | 64.5 times less |
| Bare ETH transfer, OP Mainnet | 0.0000857 | 0.0000273 to 0.0002492 | 582 | 368.8 times less |
Read on ; the maker can change a screen without saying so.
How We Read the Chain Ourselves
The chain was read straight from public nodes, because our first plan fell over. The Dune account we meant to count in turned out to be read-only. Its query endpoint answers "Your account is read-only". Its usage endpoint reports a credit quota of zero. Reading somebody else's dashboard still worked. Running our own count did not.
That failure improved the page. A public JSON-RPC endpoint answers the same questions a paid dashboard does, for anybody with a laptop: ethereum-rpc.publicnode.com for mainnet, mainnet.base.org for Base, arb1.arbitrum.io/rpc for Arbitrum. Anyone can query them for free. It also left the definitions with us, which matters more than it sounds: we decided what counts as a payment instead of inheriting somebody's filter.
The first harvest came back with a hole in it. Block 25,980,000 answered with nothing at all, as though it had never been mined, while 25,971,962 and 25,990,000 both handed over full receipts. Public endpoints sit behind a balancer with archive and pruned backends mixed together. A null there means this backend has not kept the block, not that the block was empty. We rotated across three endpoints with a retry, which fixed it. Taking the first answer at face value would have thinned the sample silently.
Two outside counters agree with us about the pace of the chain, then argue with us about the price. Blockchair corroborates the block time at 12.0485 seconds against our 12.0528, a gap of 0.04%. Its daily transaction count of 1,832,002 sits 0.63% from ours. Its fee reading contradicts ours: it prints a median of US$0.0512 across every transaction on the network, more than double our US$0.0223. Both readings are right about different things. Theirs counts swaps and contract calls, ours deliberately does not, which is the whole reason for defining the operation before counting it.
Stablecoins Cost 4.76 Times More
Stablecoins cost 4.76 times what ETH costs on the same chain. A median USDT or USDC transfer came to CAD 0.1503. Our own brief guessed two to three times, so the guess was low by nearly half.
Two multipliers stack. A token transfer needs 46,109 units of gas against the flat 21,000 of a bare transfer, because it runs code instead of moving a balance. Its senders also paid 0.8852 gwei per unit against 0.4101. That is 2.20 times the work at 2.16 times the price, which multiplies out to about 4.74; the 4.76 above is the same gap measured in Canadian dollars, where each fee was converted at its own day's rate.
The second half is what most comparisons miss. Tokens move during office hours, in a hurry, while bare ETH payments are spread across the clock.
USDT costs more than USDC, though the code is barely to blame. Gas use barely differs: 46,109 units against 45,160, a 2% gap. The gas price its senders picked carries the rest, a round 1.0000 gwei against 0.5745. End result, CAD 0.1751 against CAD 0.1067, or 1.64 times.
Either way you are spending cents, so the chain is rarely what decides a deposit.
Rollup Fees Are Smaller, with a Catch
Rollup fees for the same payment ran CAD 0.0016632 on Arbitrum One, CAD 0.0004894 on Base and CAD 0.0000857 on OP Mainnet. Against mainnet that is 19.0, 64.5 and 368.8 times cheaper. Arbitrum folds its data charge inside gasUsed, where a median payment shows 21,287 units rather than the flat 21,000. Base and OP Mainnet bill the same charge as a separate l1Fee field on the receipt. Skip that field and the OP figure comes out low, since the Ethereum share is 6.53% of its median against 0.95% on Base.
Here's the first catch. Getting onto a rollup costs a mainnet transaction, which we did not price.
A bridge deposit is a contract call, so its gas spend sits far above 21,000. The saving therefore starts with your second payment. For a single deposit it may vanish entirely.
The second catch costs real money. A rollup address looks exactly like a mainnet address, the same twenty bytes, yet the operator has to be running a wallet on that chain for anything to land. Cloudbet is the only casino in our file that prices each chain it credits, all four of them: Ethereum, Arbitrum, BNB Smart Chain, Base. mBit Casino names a chain too, by taking ERC-20 and nothing else. We do not recommend sending ETH to a rollup deposit address before the operator has named that chain in writing. A payment to a chain nobody watches doesn't arrive late. It lands nowhere.
The Cheapest Hour Is 01:00 UTC
The cheapest hour to move ETH was 01:00 UTC, at a median of CAD 0.0094. The dearest was 15:00 UTC, at CAD 0.1136. Inside one day that is a spread of 12.1 times.
For Toronto, read 21:00 against 11:00. For Vancouver, 18:00 against 08:00. A Canadian evening runs roughly ten times cheaper than a Canadian late morning, which is the rare piece of this page you can use tonight.
Weekends work the same way. Saturday's median sat at CAD 0.0153, Sunday's at CAD 0.0125, against CAD 0.0357 on a median weekday. Monday was the worst day of the month at CAD 0.0494. The full hour-by-hour table sits at the foot of this page, Toronto and Vancouver clocks included.
If none of those windows fits your evening, stop timing it. The whole distance between the dearest hour and the cheapest is about ten Canadian cents. A deposit you make while you are awake is worth more than a dime.
That advice flips if you are moving a stablecoin instead. There the daily swing is only 5.1 times, from CAD 0.0619 at 04:00 UTC to CAD 0.3136 at 16:00, but every reading starts five times higher.
A Confirmation Takes 12.0528 Seconds
One confirmation takes 12.0528 seconds, and it is the only clock a player really gets. Ethereum produced 215,053 blocks in our window, from 25,971,962 to 26,187,015. Divide one by the other and you get 12.0528 seconds apiece, against a nominal slot of 12. The interval is rigid: the median gap between a sampled block and its parent was 12.0 seconds; so was the ninetieth percentile. Five of the 720 sampled blocks (0.69%) came in 24 seconds or more behind their parent, which is where the extra 0.44% hides.
Multiply by whatever your casino waits for, and there the trail goes cold. Not one of the eight casinos in our file publishes a confirmation count. Cloudbet describes the mechanism without the number, saying deposits are credited following the number of network confirmations required for the relevant cryptocurrency. That sentence hands you the outline of a rule with none of its content.
So convert it yourself, and treat the answer as a floor instead of a promise. The operator's own processing sits on top of the chain, and none of the eight puts a figure on that either.
| Confirmations waited | Seconds | On a clock |
|---|---|---|
| 1 | 12.1 | 12 seconds |
| 3 | 36.2 | 36 seconds |
| 6 | 72.3 | 1 min 12 s |
| 12 | 144.6 | 2 min 25 s |
| 20 | 241.1 | 4 min 01 s |
| 30 | 361.6 | 6 min 02 s |
| 64 | 771.4 | 12 min 51 s |
A Reverted Transfer Still Charges You
A reverted transfer is billed in full and moves nothing. Over the month, 1.7935% of what we read came back that way: 3,321 transactions out of 185,167. Scaled across the period, roughly 32,857 fail per day. Call it 116 ETH, near CAD 431,800, burned in a month on payments that never happened.
The headline rate is the wrong rate for a deposit, though. Among bare ETH payments the reverted share was 0.6923%. Among transactions addressed to the USDT and USDC contracts it was 0.4308%, at a median loss of CAD 0.0900. Across the whole sample the median failure cost its sender CAD 0.0656, twice the median successful payment, because the things that usually fail are contract calls with a median gas spend of 70,029.
| Operation | Share reverted | Transactions read | Median fee lost, CAD |
|---|---|---|---|
| Everything in our sample | 1.7935% | 185,167 | 0.0656 |
| Bare ETH payments | 0.6923% | 54,460 (the scan's own total, which counts the 377 refused sends alongside the 54,083 that moved) | counted with the sample |
| Sent to USDT or USDC | 0.4308% | 43,871 | 0.0900 |
The 377 Transfers That Looked Normal
377 of those failures burned exactly 21,000 gas with empty data, the fingerprint of an ordinary payment.
We opened them one at a time.
Code sat on 294 of the 295 recipients. Code like that refuses the incoming ETH on its first instruction, so the gas spend stops at the floor, where the transfer dies.
Across the 377 we found 295 distinct recipients. Code sat on 294 of them when we checked. Exactly 23 bytes of it sat on 228, which is the delegation designator of EIP-7702: an ordinary wallet pointed at smart-contract logic that will not take a bare payment.
One honest limit on that. We asked for the code on , not at the block of each transaction, so bear one caveat in mind: a 7702 delegation can be set or dropped at any moment. The claim we can defend is that the code was there when we looked.
The practical reading survives either way. Should a deposit address you were handed happen to be a contract that refuses bare payments, the fee leaves your wallet, the money stays, and the transaction looks sent.
Fees Against a Real Casino Deposit
Against a real casino deposit the fee stops looking like a fee. On the address Etherscan labels Stake.com, 24,613 inbound ETH transfers arrived during the period, totalling 3,776.5056 ETH. The median one in our own scan was 0.025587 ETH, or CAD 98.77. Moving it cost 0.000008611 ETH, or CAD 0.0316, which is 0.034% of the amount. Both percentages on this page are worked in ETH, since every fee was converted at the rate of its own transaction day, so dividing the Canadian figures gives a slightly different answer.
The bottom of that distribution is where it bites. Almost a third of the inbound payments (32.3%) were under 0.01 ETH, roughly CAD 37. The smallest tenth sat at 0.000149 ETH, about CAD 0.57. The same median fee against a deposit that size is 5.77%, again in ETH.
Asked for the one number here that should change what a reader does, we would pick that 5.77%. At the bottom of the range the chain charges card-processing money. At CAD 98.77 it charges nothing you can feel.
Two things about the address before anyone quotes it. Etherscan marks it with a public Stake.com name tag, while a public Dune query filters on the same twenty bytes. We call it a labelled address rather than a wallet, because a public tag is a third party's attribution, not the operator's word. Our scan covered a sample of blocks and scales to roughly 2,260.9 ETH against the exact aggregate of 3,776.5056. The aggregate counts payments arriving through contracts, while our scan sees only top-level transactions. That is why the median here comes from the scan, with the average taken from the aggregate alone.
What These Fees Do Not Buy
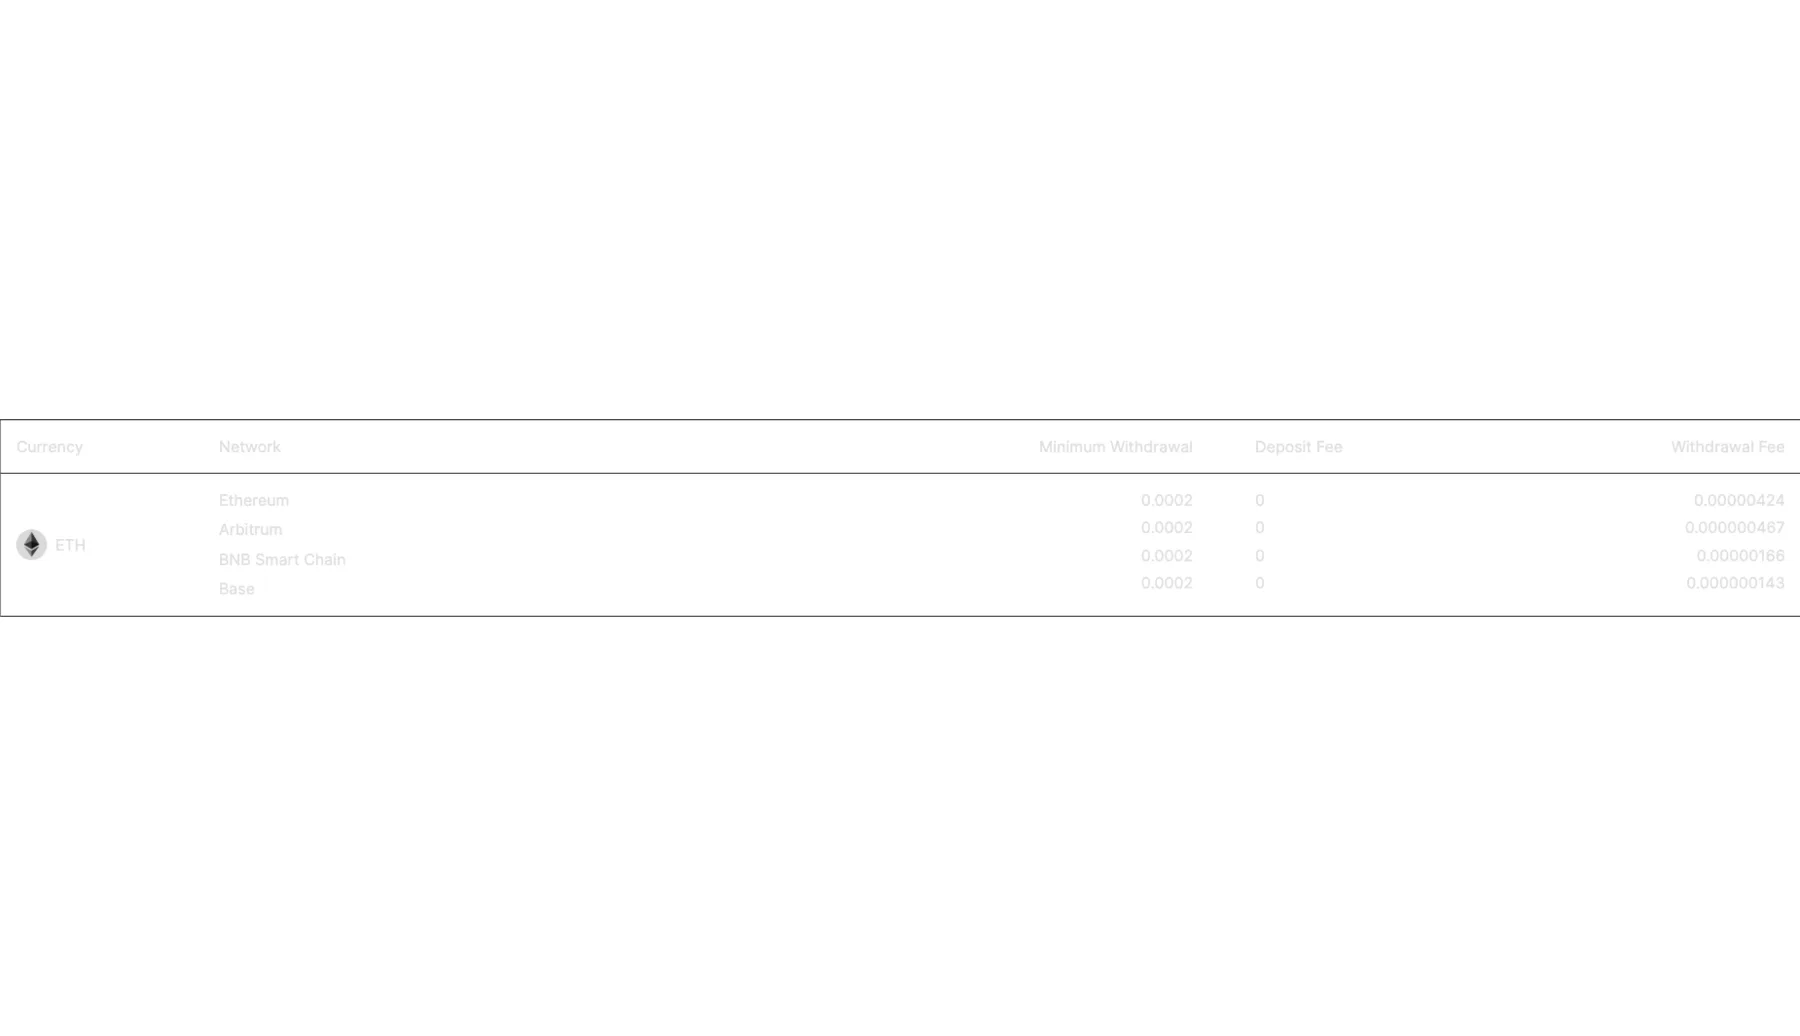
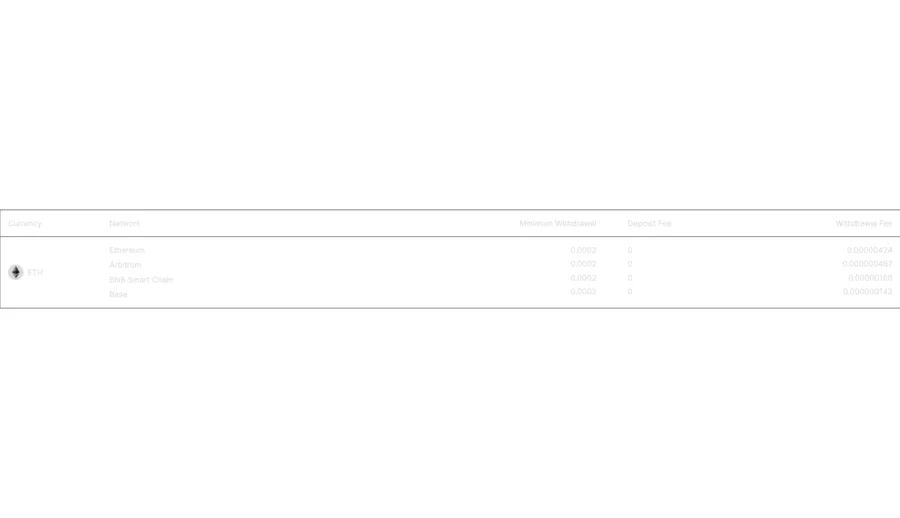
These fees buy a transfer on a chain, which is a different thing from the price of a deposit. Seven operators of the eight we read publish no charge of their own. Cloudbet prints a table, charges zero to deposit, then lists a withdrawal fee of 0.00000424 ETH on Ethereum, 0.000000467 on Arbitrum, 0.000000143 on Base. Its minimum withdrawal is 0.0002 ETH on each of the four chains.
Even that table is a reading, not a rate card. We opened it twice on the day of the measurement, and the BNB Smart Chain line moved between readings, from 0.00000167 to 0.00000166 ETH. Cloudbet says as much itself: rates follow the network. Treat any operator fee you copy, ours included, as a figure with a timestamp.
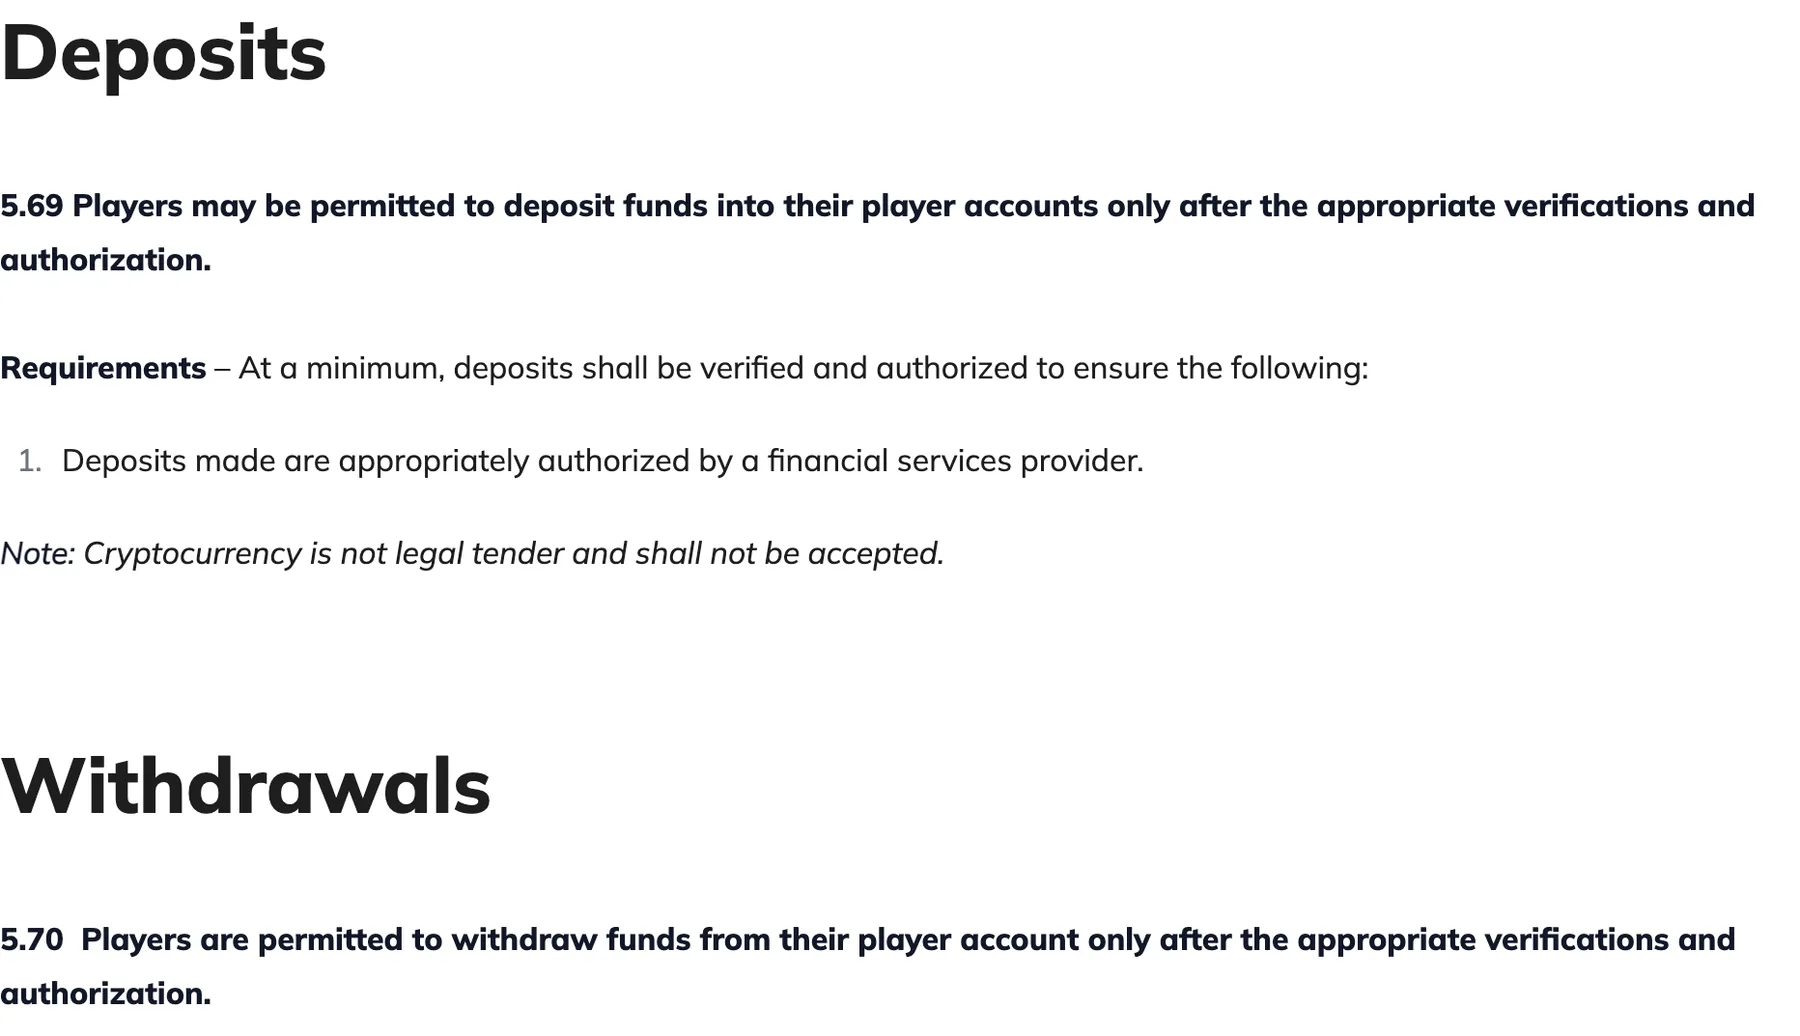
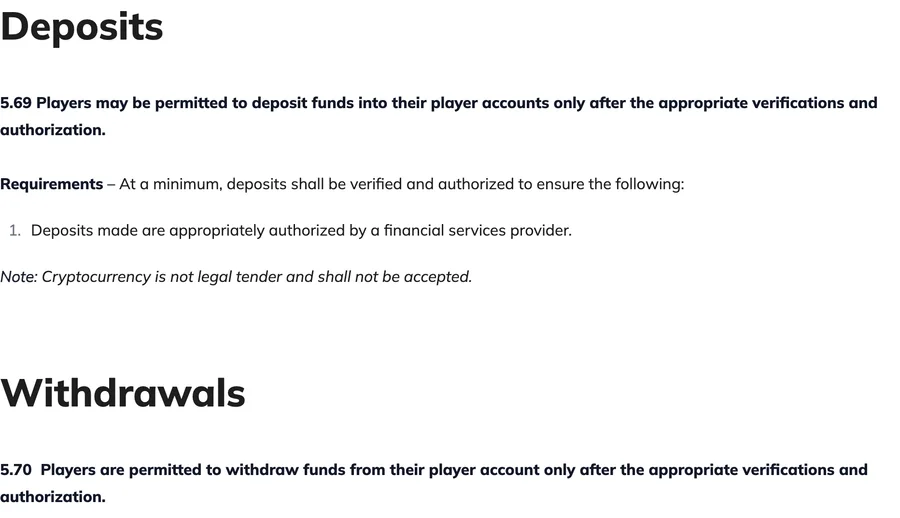
Three cents of gas also buys no regulated market. The note under Standard 5.69 of the AGCO's Registrar's Standards for Internet Gaming reads that cryptocurrency is not legal tender and shall not be accepted. Whatever the chain charges, the payment lands at a casino outside the market Ontario registers. The fee is cheap, the fee is checkable; the counterparty is neither, and only one of those two facts is about money.
Run the Same Count Yourself
The whole count runs on free endpoints and one evening. Our window is pinned by block numbers rather than dates, 25,971,962 to 26,187,015, found by binary search on block timestamps. The harvest is three passes: one per chain for the payments, one for the failures, one analysis pass that prints the tables above. Fees convert at the ETH rate of the calendar day each transaction landed, rather than at one rate for the whole month. ETH traded at CAD 3,461.60 on the day we finished, with a 30-day mean of CAD 3,696.76.
Two warnings for anyone repeating this. Public nodes hand back a null receipt occasionally, so rotate endpoints instead of trusting the first reply. Third-party explorers cap you at a hundred rows, then stop answering your address altogether.
We can't promise next month looks like this one, either. Gas price is a market. Ours moved by a factor of 12.1 inside a single day.
If all you want is one figure, read an hour of blocks at 01:00 UTC against an hour at 15:00, then compare the two medians. A few hundred receipts show the difference. You will have measured your own deposit window instead of trusting ours.
Withdrawals rates are determined by the blockchain network and can fluctuate without notice due to factors such as network congestion.Cloudbet, crypto transaction fees page, read 14 October 2026
Hourly Fees in Toronto Time
| Hour, UTC | Toronto | Vancouver | Transfers read | Median fee, CAD |
|---|---|---|---|---|
| 00:00 | 20:00 | 17:00 | 1,910 | 0.0208 |
| 01:00 | 21:00 | 18:00 | 2,402 | 0.0094 |
| 02:00 | 22:00 | 19:00 | 2,861 | 0.0100 |
| 03:00 | 23:00 | 20:00 | 2,441 | 0.0132 |
| 04:00 | 00:00 | 21:00 | 1,678 | 0.0168 |
| 05:00 | 01:00 | 22:00 | 1,713 | 0.0119 |
| 06:00 | 02:00 | 23:00 | 1,952 | 0.0143 |
| 07:00 | 03:00 | 00:00 | 2,050 | 0.0124 |
| 08:00 | 04:00 | 01:00 | 2,006 | 0.0221 |
| 09:00 | 05:00 | 02:00 | 1,834 | 0.0314 |
| 10:00 | 06:00 | 03:00 | 2,166 | 0.0270 |
| 11:00 | 07:00 | 04:00 | 2,528 | 0.0210 |
| 12:00 | 08:00 | 05:00 | 2,525 | 0.0365 |
| 13:00 | 09:00 | 06:00 | 2,335 | 0.0734 |
| 14:00 | 10:00 | 07:00 | 2,460 | 0.0937 |
| 15:00 | 11:00 | 08:00 | 2,382 | 0.1136 |
| 16:00 | 12:00 | 09:00 | 2,440 | 0.1128 |
| 17:00 | 13:00 | 10:00 | 2,535 | 0.0822 |
| 18:00 | 14:00 | 11:00 | 2,530 | 0.0405 |
| 19:00 | 15:00 | 12:00 | 1,850 | 0.0531 |
| 20:00 | 16:00 | 13:00 | 2,486 | 0.0375 |
| 21:00 | 17:00 | 14:00 | 2,794 | 0.0236 |
| 22:00 | 18:00 | 15:00 | 1,956 | 0.0228 |
| 23:00 | 19:00 | 16:00 | 2,249 | 0.0133 |
Key Terms Used on This Page
- gwei
- The unit a gas price is quoted in; a bare ETH transfer ran at a median 0.4101 gwei in the month we read.
- Gas unit
- The chain's unit of work; a bare ETH transfer burns exactly 21,000 of them, a USDT transfer a median 46,109.
- Reverted transaction
- A transaction that pays and then fails; 1.7935% of what we read reverted, at a median loss of CAD 0.0656.
- Rollup
- A chain that settles its results to Ethereum; the same transfer cost CAD 0.0004894 on Base against CAD 0.0316 on mainnet.
- EIP-7702 designator
- A 23-byte pointer that hands a wallet over to contract logic; 228 of the 294 refusing addresses carried one.
This site takes no deposits and runs no identity checks; both stay off it entirely.
Related Reading
More on this subject, from the same section first:
 Reference
Games and Exclusions
2 slots, 1 provider barred in Canada
 Reference
Legal status in Canada
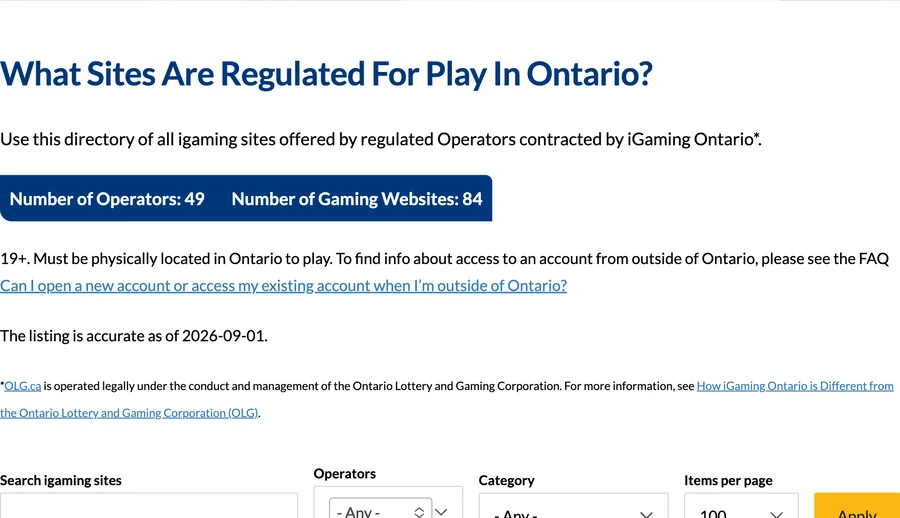
Ontario 19, Alberta and Quebec 18
 Reference
Tax rules in Canada
50% inclusion rate, records kept 6 years
 Reference
ETH or Bitcoin deposits
0.0002 ETH minimum, four networks
 Reference
Ranked by disclosure
3 of 8 disagree with the register
 Reviews
ETH Deposits From Canada
0 of 8 publish confirmation counts
 Casinos
Stake: licence check
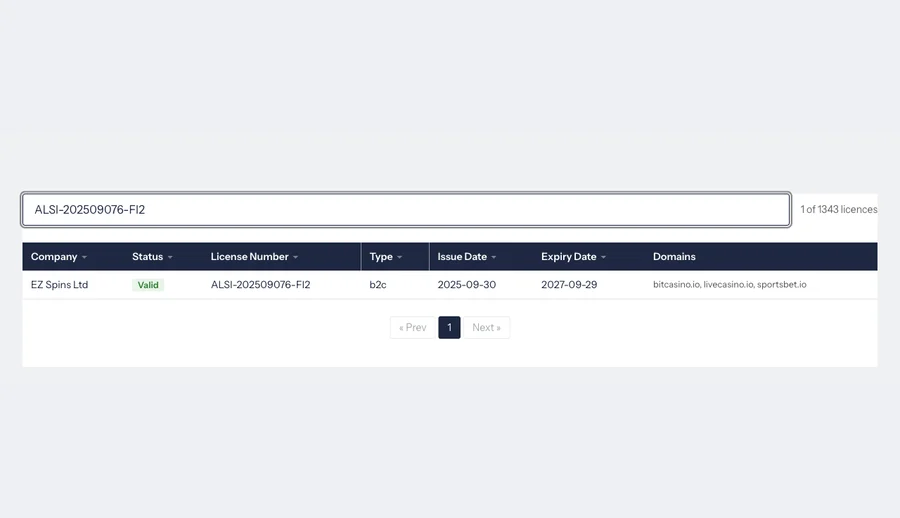
Licence OGL/2024/1451/0918, not printed on site